เวอร์ชันเดสก์ท็อปDesktop Version

DAPH Desktop v.2026.03 DAPH Desktop v.2026.03

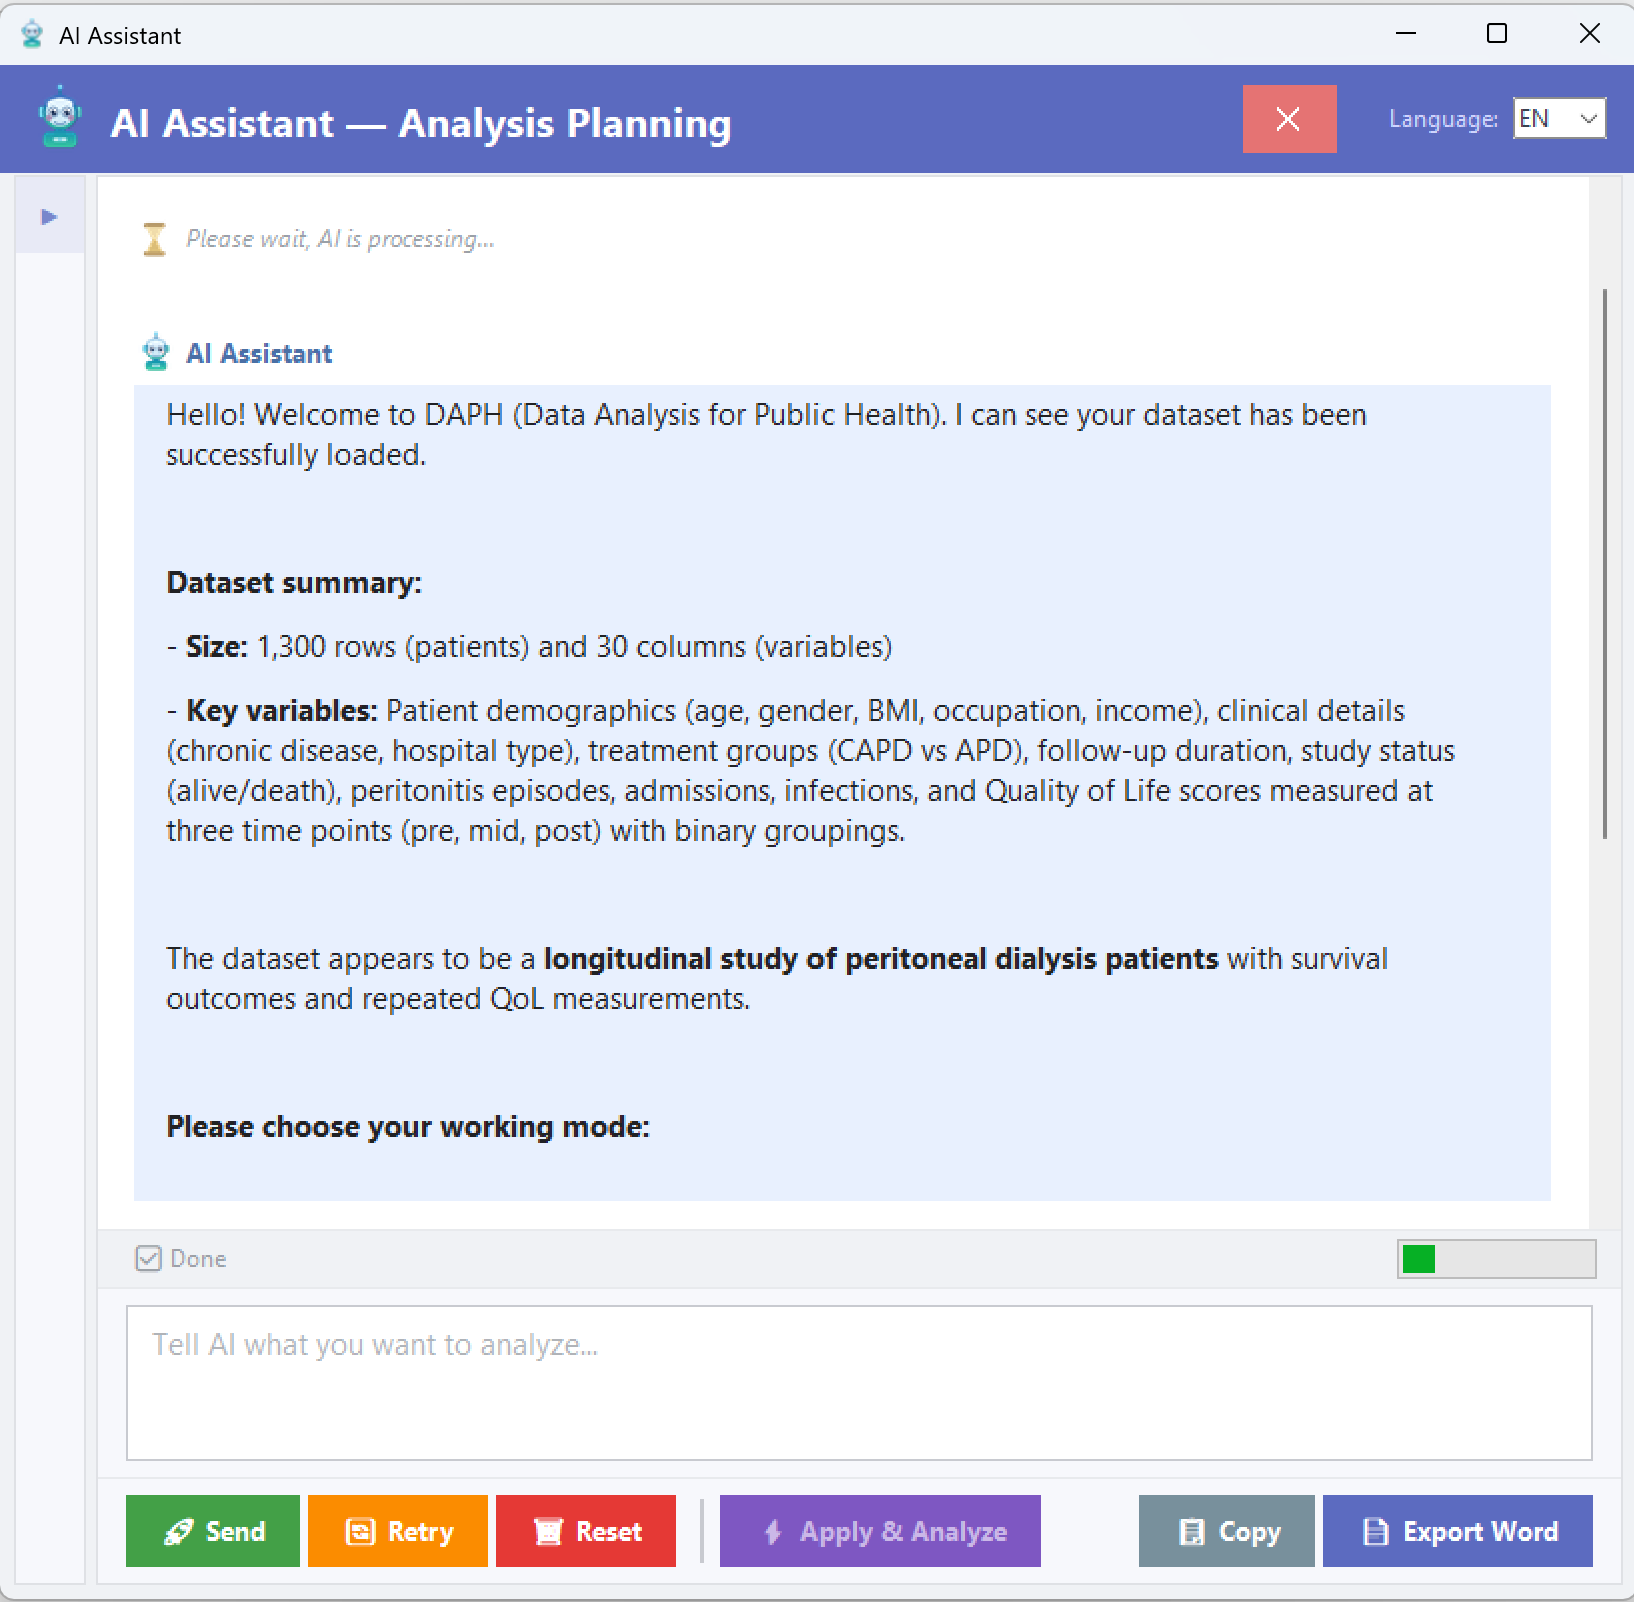
โปรแกรมวิเคราะห์ข้อมูลเพื่อการวิจัยด้านสาธารณสุข — ประมวลผลในเครื่อง ข้อมูลไม่ออกจากเครื่อง รองรับสถิติครบเซ็ต Data Analysis for Public Health Research — fully offline, your data never leaves your computer, full statistical suite

🪟 Windows 10 / 11 (x64)Windows 10 / 11 (x64) กำลังโหลดข้อมูลเวอร์ชันLoading version info 🔐 ข้อมูลประมวลผลในเครื่องProcessed locally
🔒

ประมวลผลในเครื่องLocal Processing

ข้อมูลไม่ถูกอัปโหลดไปเซิร์ฟเวอร์Data never uploaded to servers

📊

สถิติครบชุดFull Statistics Suite

Mixed effect, GEE, RM-ANOVA, ANCOVA, CoxMixed effect, GEE, RM-ANOVA, ANCOVA, Cox

AI

AI ช่วยวิเคราะห์AI Assistant

Gemini, OpenAI, Claude, DeepSeek ฯลฯGemini, OpenAI, Claude, DeepSeek, etc.

📝

รายงาน APAAPA Reports

ส่งออก Word + ร่างบทคัดย่อ + บทที่ 4Word export + abstract + Chapter 4 draft

🧭 แผนภาพการเลือกสถิติStatistical Method Selector

ใช้แผนภาพนี้เพื่อเลือกสถิติที่เหมาะกับข้อมูลและคำถามการวิจัย Use this flowchart to pick the right statistical test for your data + research question

Analysis flow

วิธีการใช้งานโปรแกรมHow to Use the Program

เนื้อหาเดียวกับเมนู "ช่วยเหลือ → วิธีการใช้งานโปรแกรม" ในตัวโปรแกรม Same content as "Help → How to Use" inside the program

1. การนำเข้าข้อมูล (แท็บ ข้อมูล)1. Importing Data (Tab: Data)

คลิกปุ่ม "นำเข้าข้อมูล" เพื่อเลือกไฟล์ข้อมูล หรือลากไฟล์มาวาง

รูปแบบไฟล์ที่รองรับ:

  • Excel (.xlsx, .xls)
  • CSV (.csv) · TSV (.tsv, .tab)
  • SPSS (.sav) · Stata (.dta, Stata BE/MP)
  • SAS (.sas7bdat) · R Data (.rds, .rdata, .rda)
  • DAPH Database (.daph)

การกำหนดประเภทตัวแปร:

  • Numerical: ข้อมูลตัวเลขต่อเนื่อง (อายุ น้ำหนัก ส่วนสูง)
  • Categorical: ข้อมูลหมวดหมู่ (เพศ กลุ่มการรักษา)

จัดการตัวแปร:

  • คลิกขวาที่ตัวแปร → เปลี่ยนประเภท, จัดกลุ่ม, กำหนด Label
  • ดับเบิลคลิก → แก้ไข Value Labels
  • AI จัดกลุ่ม → แนะนำ cut point ตามทฤษฎี (Bloom, Best, Sorensen/Nutbeam)

Click "Import Data" or drag-and-drop your file.

Supported formats:

  • Excel (.xlsx, .xls) · CSV/TSV
  • SPSS (.sav) · Stata (.dta, BE/MP)
  • SAS (.sas7bdat) · R Data (.rds/.rdata/.rda)
  • DAPH Database (.daph)

Variable types:

  • Numerical: continuous (age, weight, height)
  • Categorical: sex, treatment group, etc.

Variable management:

  • Right-click → change type, group, set label
  • Double-click → edit Value Labels
  • AI Grouping → auto-suggest cut points (Bloom, Best, Sorensen)
2. การเลือกตัวแปรและวิเคราะห์ (แท็บ วิเคราะห์)2. Selecting Variables & Analysis
  1. เลือกประเภทข้อมูล Outcome: Continuous / Categorical / Count / Survival
  2. เลือก ตัวแปรตาม (Dependent) — กดปุ่ม
  3. เลือก ตัวแปรอิสระ (Independent) — กดปุ่ม
  4. เลือกประเภทสถิติ → เลือกวิธีวิเคราะห์ → คลิก "วิเคราะห์"
▸ Continuous Outcome
  • Linear regression (Enter/Backward/Stepwise/Bivariate/LMM)
  • t-test · paired t-test · Correlation (Pearson/Spearman)
  • One-way ANOVA · Mann-Whitney · Wilcoxon · Kruskal-Wallis
  • Repeated Measures ANOVA · GEE
▸ Categorical Outcome
  • Logistic Regression (OR) — Enter/Backward/Stepwise/Bivariate/GLMM
  • Unconditional Logistic (Intervention) · Conditional Logistic (Case-Control จับคู่)
  • Chi-square · McNemar
▸ Count + Survival
  • Poisson regression (IRR) — Person-time, Offset
  • Cox regression (HR) · Kaplan-Meier · Log-rank
  1. Select Outcome Type: Continuous / Categorical / Count / Survival
  2. Select Dependent Variable — click
  3. Select Independent Variables — click
  4. Pick test → Pick method → Click "Run Analysis"
▸ Continuous Outcome
  • Linear regression (Enter/Backward/Stepwise/Bivariate/LMM)
  • t-test, paired t-test, Pearson/Spearman correlation
  • One-way ANOVA, Mann-Whitney, Wilcoxon, Kruskal-Wallis
  • Repeated Measures ANOVA, GEE
▸ Categorical Outcome
  • Logistic Regression (OR) — Enter/Backward/Stepwise/Bivariate/GLMM
  • Unconditional/Conditional Logistic, Chi-square, McNemar
▸ Count + Survival
  • Poisson regression (IRR), Person-time, Offset
  • Cox regression (HR), Kaplan-Meier, Log-rank
3. การดูผลลัพธ์และส่งออก (แท็บ ผลลัพธ์)3. Viewing Results & Exporting

ผลการวิเคราะห์แสดง:

  • ตารางค่าสถิติ · p-value · 95% CI
  • กราฟประกอบผล (ดูตัวอย่างด้านล่าง)
  • การแปลผลอย่างง่าย

การส่งออก:

  • "ส่งออก Word" → เอกสาร APA พร้อมใช้
  • "บันทึกผลโมเดล" → รวมไฟล์วิจัย

Results display:

  • Statistical tables · p-value · 95% CI
  • Charts & plots (see gallery below)
  • Simple interpretation

Exporting:

  • "Export to Word" → APA-formatted report
  • "Save Model Results" → for research compilation
Results tab
แท็บ "ผลลัพธ์" — ตารางสรุป + การแปลผล + ส่งออก Word"Results" tab — summary table + interpretation + Word export
4. เครื่องมือข้อมูล + ส่งออก4. Data Tools + Export

เมนู "เครื่องมือข้อมูล":

  • จัดการ Missing Values
  • แปลงตัวแปร: Log, Sqrt, Z-score, Min-Max
  • สร้างตัวแปรใหม่ (สูตร เช่น BMI = weight / height²)
  • กรองข้อมูลตามเงื่อนไข · ลบแถวซ้ำ
  • ตรวจจับค่าผิดปกติ (IQR หรือ Z-score)

ส่งออก (File → Export):

  • Excel · CSV · SPSS · Stata 14 · DAPH · Word

Data Tools menu:

  • Missing Values management
  • Transform: Log, Sqrt, Z-score, Min-Max
  • Compute Variable (formulas e.g. BMI = weight / height²)
  • Filter · Remove Duplicates
  • Outlier Detection (IQR or Z-score)

Export (File → Export):

  • Excel · CSV · SPSS · Stata 14 · DAPH · Word
Data Tools menu
เมนู "เครื่องมือข้อมูล" — Missing Values, Transform, Compute, Filter, Outlier Detection"Data Tools" menu — Missing Values, Transform, Compute, Filter, Outlier Detection
5. วิเคราะห์เพิ่มเติม (Diagnostic · ROC · Reliability · ระบาดวิทยา · Sample size)5. Additional Analysis (Diagnostic · ROC · Reliability · Epi · Sample size)
  • สถิติเชิงพรรณนา: Mean, Median, SD, FrequencyDescriptive: Mean, Median, SD, Frequency
  • Diagnostic Test: Sensitivity, Specificity, PPV, NPVDiagnostic: Sensitivity, Specificity, PPV, NPV
  • ROC Curve (AUC)ROC Curve (AUC)
  • Cronbach's AlphaCronbach's Alpha
  • Agreement: Cohen's Kappa, ICCAgreement: Cohen's Kappa, ICC
  • Sample Size (8 สูตรตามประเภทสถิติ)Sample Size (8 formulas)
  • ระบาดวิทยา: OR, RR, Incidence RateEpi: Odds Ratio, Relative Risk, IR
  • Assumptions Checker: Normality, Homogeneity, LinearityAssumptions: Normality, Homogeneity, Linearity
AI6. ฟีเจอร์ AI6. AI Features
  • AI
    AI AssistantAI Assistantพูดคุย สั่งการวิเคราะห์ ควบคุมโปรแกรมผ่าน ChatChat-based program control and analysis
  • AI
    AI แปลผลAI Interpretationแปลผลเป็นภาษาวิชาการสำหรับบทที่ 4Academic language for Chapter 4
  • AI
    รวมผลวิจัยResearch Compilationรวมไฟล์ Word เป็นรายงานบทที่ 4 ฉบับสมบูรณ์Combine Word files into report
  • AI
    AI เขียนบทคัดย่อAI Abstract Writerสร้างบทคัดย่อ 300-350 คำGenerate 300-350 word abstract
  • AI
    AI ร่างงานวิจัยAI Manuscript Drafterร่างต้นฉบับ 3,000-4,000 คำDraft 3,000-4,000 word manuscript
  • AI
    AI จัดกลุ่มตัวแปรAI Variable Groupingแนะนำ cut point ตามทฤษฎี (Bloom/Best/Sorensen)Cut points via theory (Bloom/Best/Sorensen)

รองรับ provider: Google Gemini (ฟรี), OpenAI, Claude, DeepSeek, Mistral, Qwen, xAI, Meta/Llama, Nova/AWS Supported: Google Gemini (free), OpenAI, Claude, DeepSeek, Mistral, Qwen, xAI, Meta/Llama, Nova/AWS

AI Assistant dialog
AI Assistant — พูดคุยกับ AI เพื่อสั่งการวิเคราะห์และแปลผลAI Assistant — chat-based analysis control + interpretation
💡 7. คำแนะนำและเคล็ดลับ7. Tips & Recommendations

การเตรียมข้อมูล:

  • ตรวจสอบไม่มีค่าว่างมากเกินไป
  • ตั้งชื่อคอลัมน์ชัดเจน ไม่มีอักขระพิเศษ
  • ข้อมูลหมวดหมู่เข้ารหัสชัดเจน (0=หญิง, 1=ชาย)

การแปลผล:

  • p-value < 0.05 มักถือว่ามีนัยสำคัญ
  • 95% CI ไม่รวม 1 (OR/HR/IRR) หรือ 0 (Coef.) → มีนัยสำคัญ

Data preparation:

  • Ensure not too many missing values
  • Clear column names, no special characters
  • Clear categorical coding (0=F, 1=M)

Interpreting results:

  • p-value < 0.05 generally significant
  • 95% CI excluding 1 (OR/HR/IRR) or 0 (Coef.) → significant

🎨 ตัวอย่างกราฟที่โปรแกรมสร้างให้Sample Charts Generated by DAPH

ทุกกราฟส่งออกเป็น PNG ความละเอียดสูง และฝังใน Word ได้อัตโนมัติ All charts export as high-resolution PNG and embed automatically in Word

Line Trend
Line Trend
Forest Plot
Forest Plot
Violin Plot
Violin Plot
Residual
Residual Plot
Correlation Heatmap
Correlation Heatmap
Correlation Network
Correlation Network
Survival Curve
Kaplan-Meier Survival Curve

พร้อมเริ่มวิเคราะห์แล้ว?Ready to start?

ดาวน์โหลดเวอร์ชันล่าสุดและติดตั้งบน Windows — ใช้งานได้ทันที ไม่ต้องเชื่อมต่ออินเทอร์เน็ต Download the latest version and install on Windows — runs offline out of the box

ก่อตั้งโดย รศ.ดร.กิตติพงษ์ สอนล้อม · Khon Kaen University Founded by Assoc.Prof.Dr.Kittipong Sornlorn · Khon Kaen University

Cite this software · APA 7

ใช้ DAPH ในงานวิจัย? อ้างอิงแบบนี้Used DAPH in your research? Cite it like this

ดูทั้งหมด → /citeFull citation page → /cite

Sornlorn, K. (2026). DAPH: Data Analysis for Public Health Research (Version v.2026.03) [Computer software]. InnovaGeoTech. https://innovageotech.com/cite